50 cubic metres out — and still counting correctly
My gas meter has two data sources: an accurate one days behind, and a current one with a wrong starting value. Only together are they worth anything.
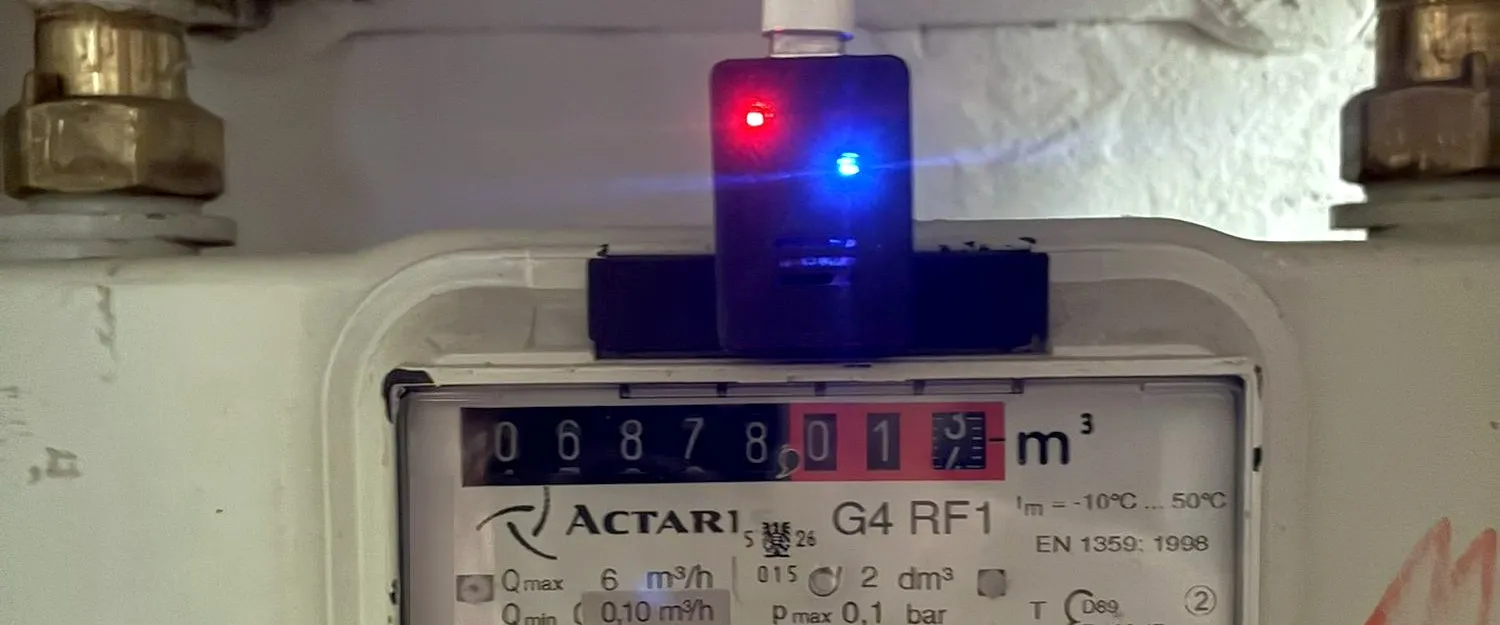
My gas meter in Vienna reads 6872.722 m³. The device that reads it reports 6822.30 m³. Fifty cubic metres apart.
The obvious reaction would be to declare the reading head broken. It would be wrong. The head counts every single pulse correctly — it was just given a starting value that is too low.
The difference between those two diagnoses is the whole article. And it decides whether you correct a value once or spend months fiddling with hardware.
Two sources, neither usable alone
There are two routes to the same meter:
| Wiener Netze interface | Local reading head | |
|---|---|---|
| Accuracy | accurate | starting value too low |
| Freshness | days behind | minutes |
The Wiener Netze interface delivers daily consumption as JSON. I measured it: the history starts in October 2025, 309 days, total 1005.400 m³. It is the authoritative figure — but it lags.
How much showed on 31 August. The meter read 6872.881 m³. The interface already knew about the days but booked 0.0 consumption. The local device had reported the same consumption at 05:26 that morning.
Accurate and stale on one side, current and wrong on the other.
The join
live = cloud reading + (device now − device at last cloud sync)An automation resets the marker every time the interface reports. That makes the surcharge fall back to zero as soon as the cloud catches up — drifting apart over weeks is impossible.
I fell into it myself while building. The cloud caught up while I was setting the marker by hand. The sensor added the same consumption a second time and showed 6873.122 instead of 6872.922.
The template therefore now compares timestamps: the surcharge applies only if the marker is newer than the cloud reading. If it is older, the increase is already in the cloud value and the sensor simply shows that.
It can therefore never be worse than the better of its two sources. That is the property that matters in composed values.
Offset or counting error — two things that look alike
Now to the real question. The fifty cubic metres have two possible explanations, and in a snapshot they are indistinguishable:
| Signature | Remedy | |
|---|---|---|
| Offset | the gap stays constant | correct the starting value once |
| Counting error | the gap grows or shrinks | debounce or mounting |
That same morning I had guessed counting error and suspected the debounce time. That was wrong, and here is how it came out.
The decisive hint from support
The pulse sensor triggers when the second decimal reads 6. That makes the pulses no longer a matter of estimation but of prediction:
28.08.  6872.722   last pulse at 6872.66
31.08.  6872.881   in between: 6872.76 and 6872.86   ->  2 pulses expected
The device counted exactly 2. The next had to fall at 6872.96 — and it did.
Over six days: 6 of 6 pulses. After six weeks: 53 of 53. The gap did not grow.
So it is settled: a pure offset. The head counts correctly, its stored starting value is too low. The history fits — the value had once been adjusted upwards at the grid operator when the head was not running cleanly. Apparently in their cloud, but not in the device.
Two measures that do not work
There are two traps here, and I fell into both.
The raw gap does not work. It moved from 50.422 to 50.363. That looks like drift and is not: the device counts in steps of 0.1 while the reading runs continuously. Up to ±0.1 m³ of variation is therefore inevitable and means nothing.
The naive pulse expectation does not work either. consumption ÷ 0.1 assumes
counting starts at the starting value. Between 6872.722 and 6873.063 lie
0.341 m³ but four transitions — the naive calculation expected three and
reported an error that did not exist.
The checking script has since counted the fixed positions at …,x6. That makes
the statement sound after a few pulses instead of after cubic metres.
And to be explicit: 0.159 m³ is not proof. At 0.1 m³ resolution you need several cubic metres, meaning the heating season. The all-clear was initially a well-supported assumption, not a result.
Entering readings, with verification
A measurement chain is only as good as its cross-check. Hence a table of readings — and three checks on entry:
| Case | What happens | |
|---|---|---|
| 1 | field empty or 0 | rejected |
| 2 | lower than the last reading | rejected — a gas meter does not run backwards |
| 3 | over 20 m³ a day | rejected until confirmed |
Rejected means: a message saying why and what to do — and the input stays put so it can be corrected rather than retyped.
In case 2 the message explicitly asks about a meter replacement. If confirmed, the entry is recorded as a change and consumption for that period is not calculated — not set to zero. Zero would mean “nothing used”, and that would be a claim.
The 20 m³ limit is not a round guess: the summer base load is 0.046 m³ a day, the annual mean around 1.65. A cold winter day stays in single digits. This flat has never used 20 m³ in a day — that is a typo.
A trap spotted while building
The day difference is rounded to two places. With two readings on the same day
that gives 0.0, the division is skipped, the daily rate becomes zero — and
check 3 would fail to fire precisely when somebody is correcting a typo.
So for verification a started day counts as a whole one.
After two months: no drift
| Date | Reading | m³/day | Deviation |
|---|---|---|---|
| 13.09. | 6874.230 | — | +0.008 |
| 24.09. | 6874.876 | 0.06 | −0.146 |
| 18.10. | 6878.014 | 0.13 | +0.092 |
All three sit within the band imposed by the design and do not move in one direction. The drift suspected in September was quantisation.
A mislabelled tile gave me a fright
One sensor read 17.408 on 7 November. That looked like a serious measurement error.
It calculates “computed reading minus last reading” and therefore grows with every litre used. The 17.4 was simply the consumption of the three weeks since the last reading — 0.87 m³ a day in the heating season against 0.13 in October.
The tile has since been called “consumption since the last reading”. The only valid measure of the chain is the deviation column in the table, which records the gap at the moment of entry.
A wrong name is not a cosmetic flaw. It causes one fright and then permanent distrust of a figure that is correct.
What I would advise
- Separate offset from counting error before repairing anything. A snapshot cannot do it. You need at least two measuring points, better five.
- Find out at what reading your pulse sensor triggers. Counting then becomes predictable and you need no cubic metres to check it — a call to support settled it here.
- Expect quantisation. At 0.1 m³ resolution, ±0.1 of variation is normal. Mistake that for drift and you spend months hunting an error that is not there.
- Build a cross-check before trusting the values. A table of readings and a few plausibility rules cost one evening and catch a real error in weeks rather than years.
- Name sensors after what they calculate. Not after what you happen to need them for.
So what?
The benefit is not that I can see my gas consumption on my phone. The benefit is that I know how far I can trust the figure — and can state it precisely: ±0.1 m³ by design, no trend over two months, deviation recorded at every reading.
Most smart home meters do not fail because they measure wrongly. They fail because nobody can say how wrongly they are allowed to measure before anyone would notice.
If you want to follow this: use RSS
No newsletter. You give me no address, I keep no list, and nobody has to agree to anything to learn that an article is finished. RSS is the older and, for both sides, the more honest solution.
How it works, and why no newsletter
- 1Get a feed reader. No account needed with an app on your phone or a browser extension; use a hosted service if you prefer.
- 2Add the address above to it.
- 3Done. New articles turn up in your reader by themselves — unread stays unread, and nothing lands between invoices and ads in your inbox.
Why that is better: your reader fetches the file. I get no address and cannot see who reads or whether anyone opened it. Unsubscribing means deleting the entry — no link, no confirmation mail, no me.
Related
I checked 25 invoice lines — and my own device was wrong
Two years of gas bills recalculated line by line: largest deviation 0.016%. The number that was wrong came from my own meter reader.
The model with more physics was the worse one
Four years of gas use reconstructed from 71 meter readings. My temperature model was physically sound — and off by 110 cubic metres.
My flat tells me the electricity bill in advance
At 23:50 on the last day of the month a notification arrives with consumption, cost components and the expected bill. What the forecast can do and where it ends.